Photo Node-Gallery
- Period
- 2026
- Contribution
- Design, development, and photography
- Status
- Live interactive archive

An interactive photography archive that links images by colour rather than subject. I built the graph interface, colour-processing pipeline, and comparison of five similarity configurations.

Following colour
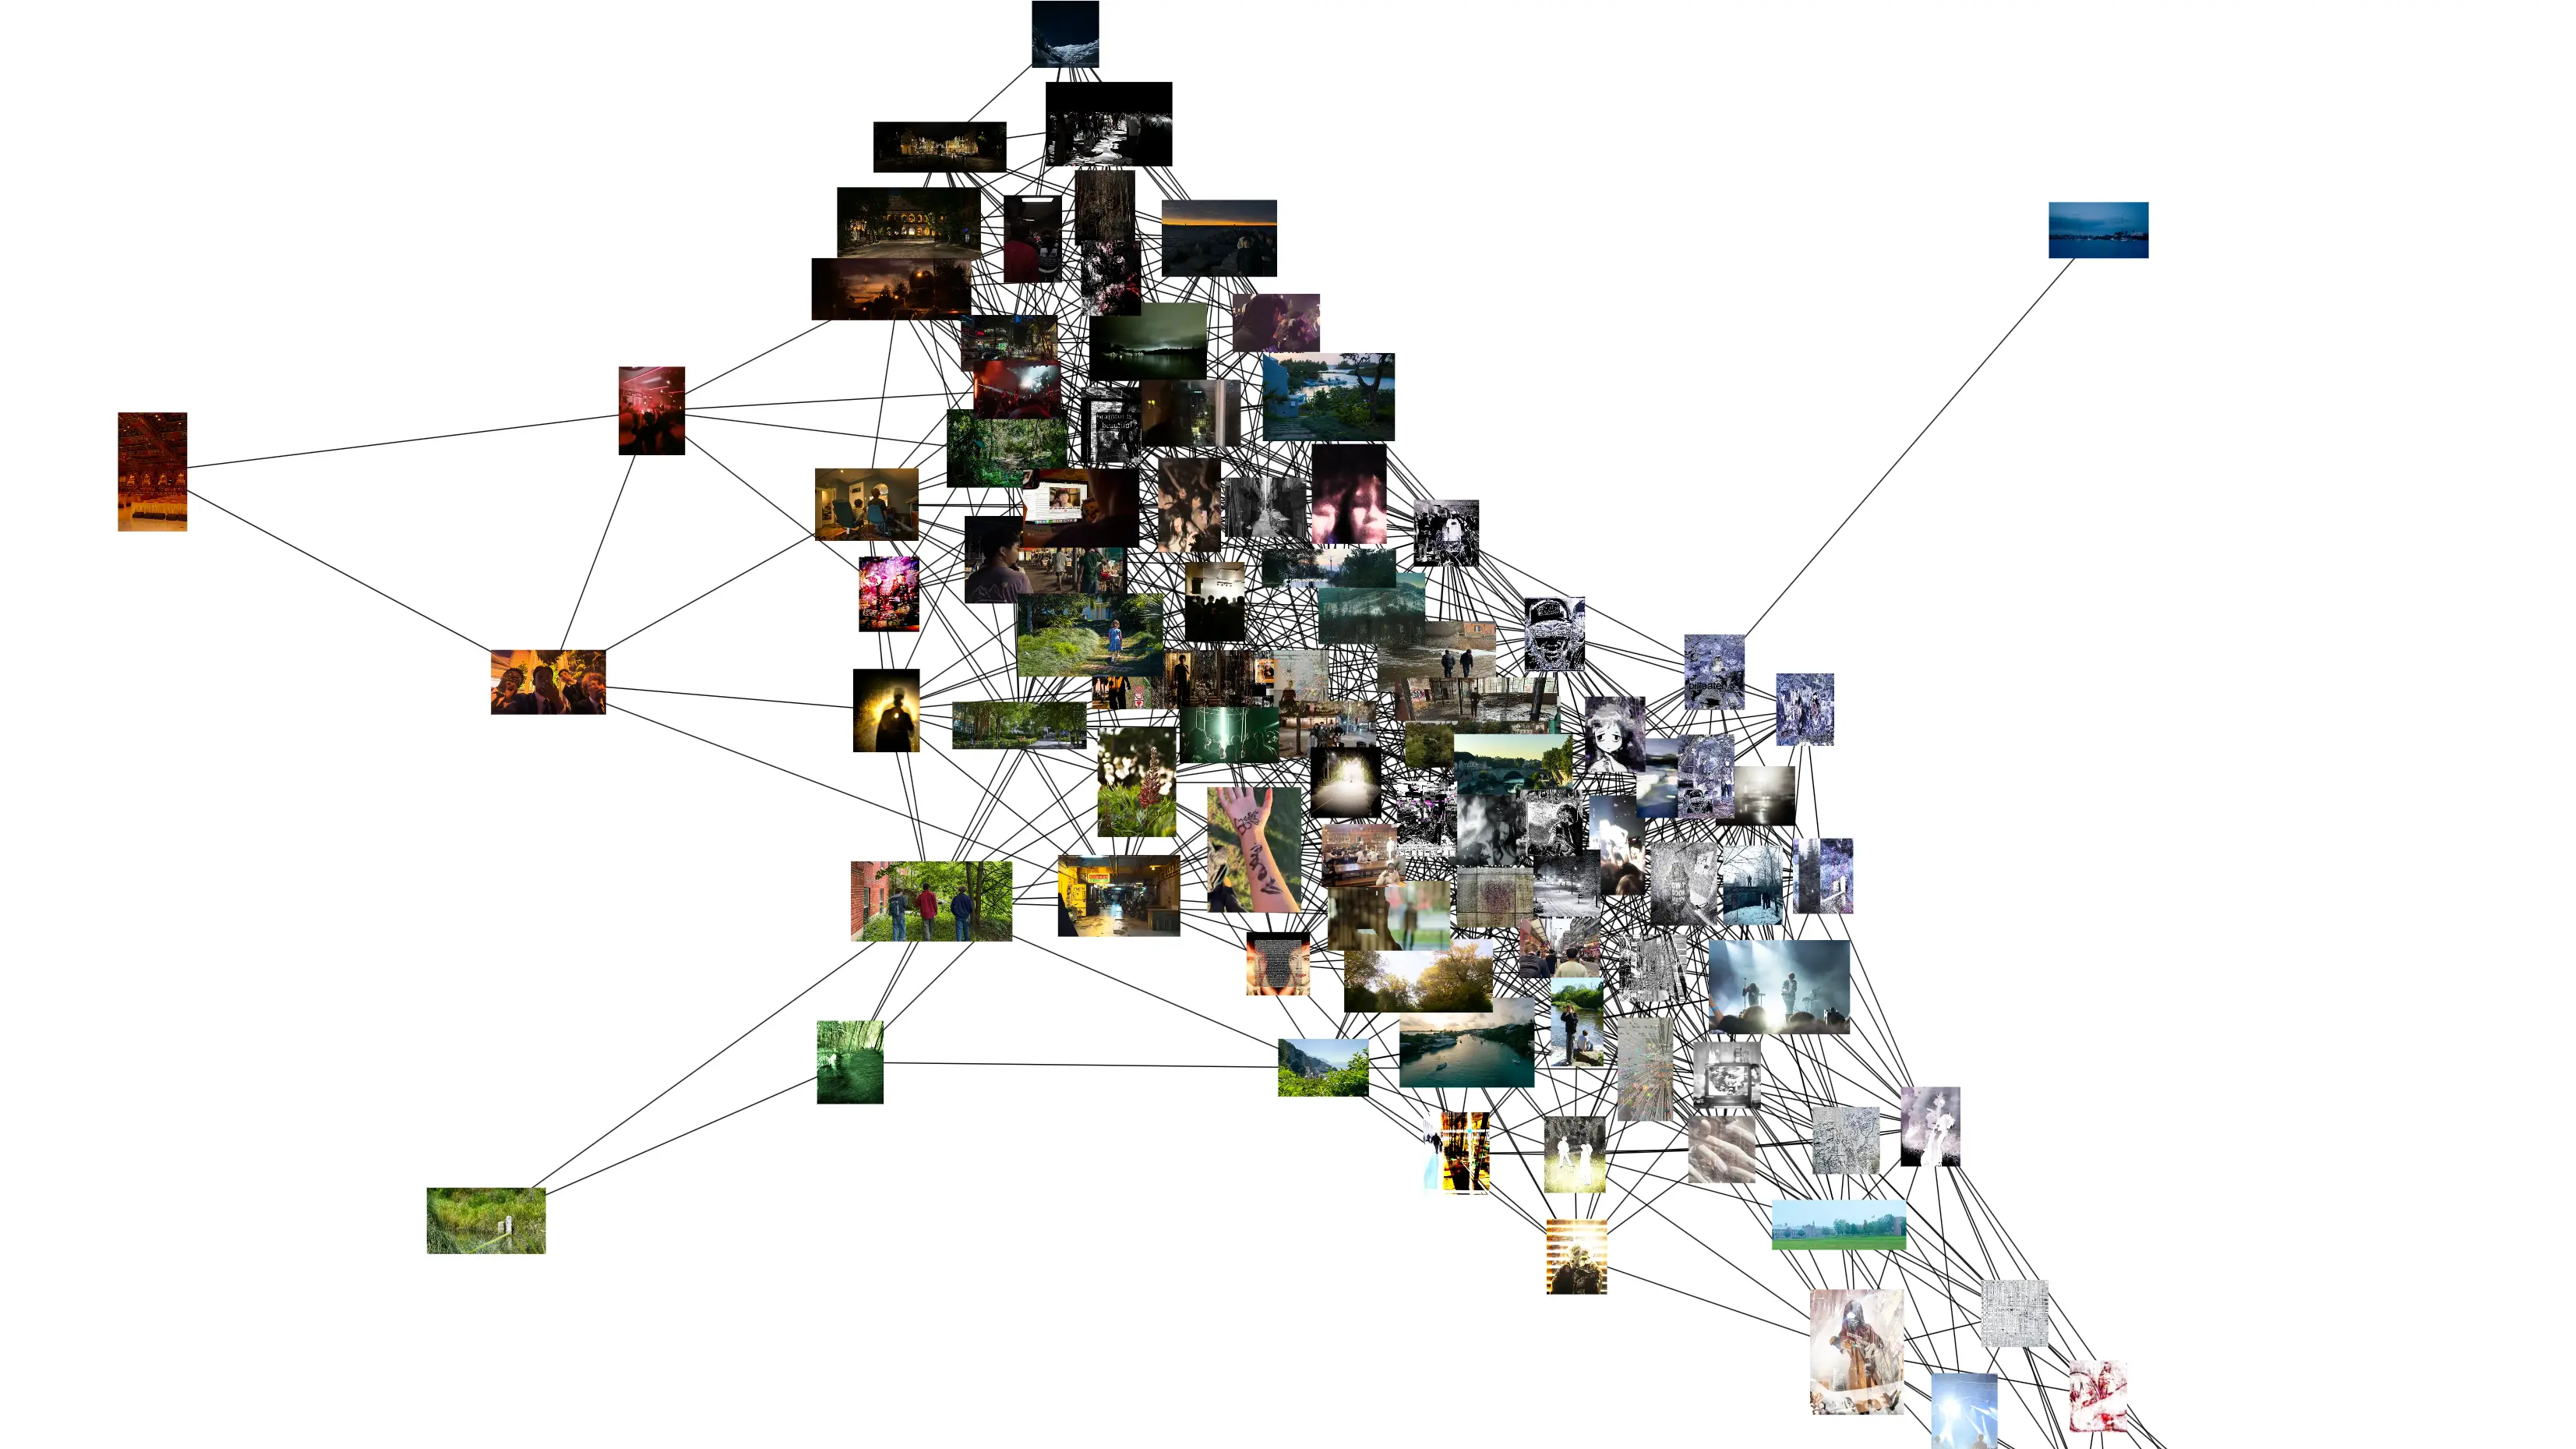
Two photographs can have little in common as subjects and still look right beside each other. I built Photo Node-Gallery to follow those connections.
Each photograph is a node. Colour similarity creates the links; a force-directed layout arranges the graph. Drag, zoom, or open an image for a closer look. Following a chain of links takes you across different subjects through shared tones.
Building the archive
Colour features are calculated ahead of time, so browsing does not require reprocessing the originals.
Next.js provides the pages and API routes. react-force-graph draws the canvas, while D3 handles the force simulation, keeping the moving photographs out of the HTML layout. Supabase stores the precomputed graph and colour features; published images are delivered from Cloudflare R2 through a shared media Worker.
Publishing a photograph must keep its node and generated relationships consistent. The database registration operation commits them together and rejects a generation based on a stale graph revision. A lost response can then be retried with the same upload identity. The database regression tests check rollback after a failed neighbour insert, rejection of stale work, and replay that returns the accepted result while leaving exactly one node.
Testing the links
The original model compared average colours using CIE76, a distance measure in LAB colour space. A mean loses the distribution of colours within an image, so I compared it with palette and distribution approaches, as well as other distances between mean colours.
The benchmark from 26 August 2026 covers 100 photographs and 7 reviewed query images, ranging from snow to coloured stage lighting.
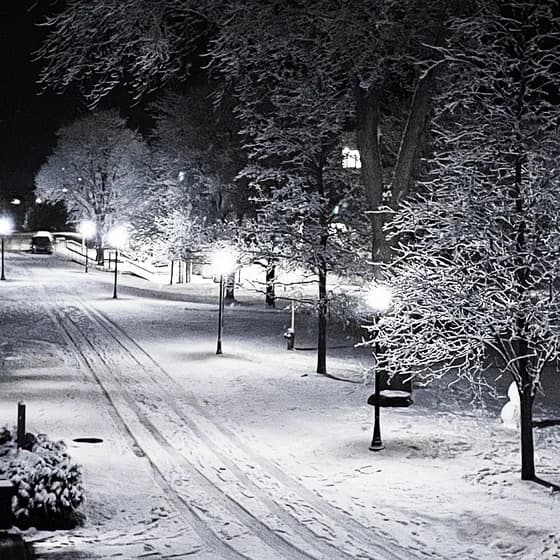
Snow / pale neutral
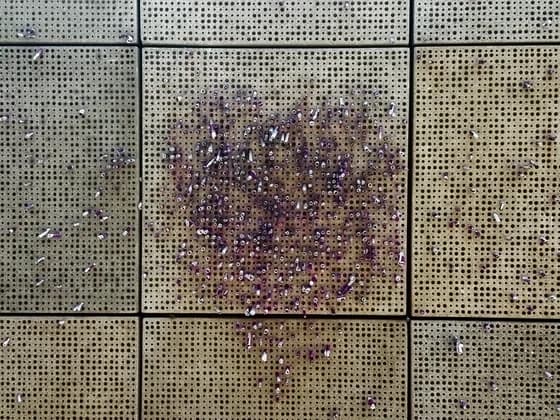
Dense neutral texture
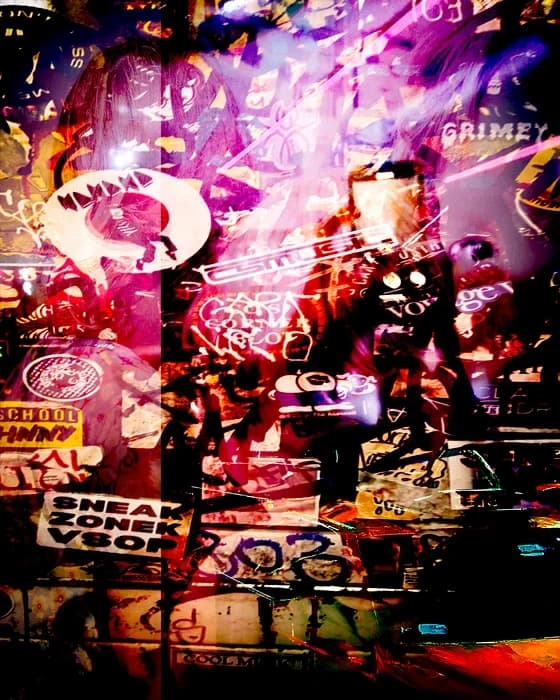
Magenta performance light
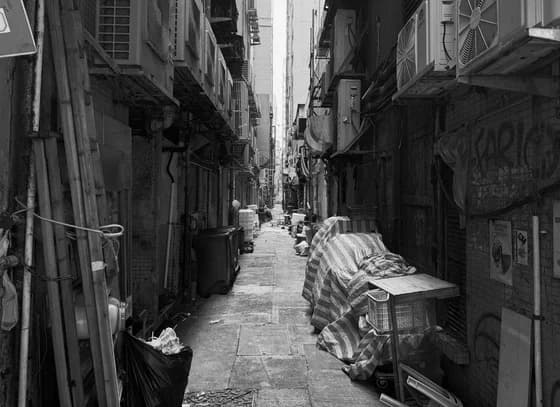
Dark monochrome
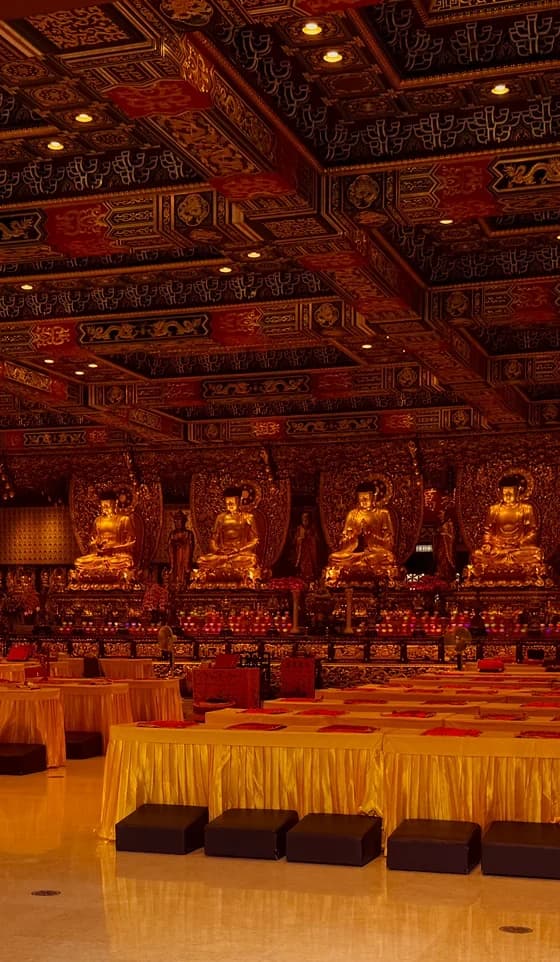
Warm amber interior
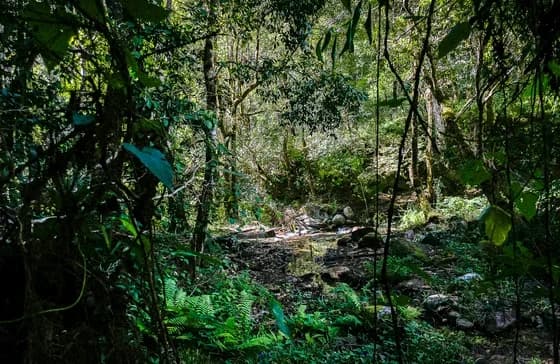
Woodland green
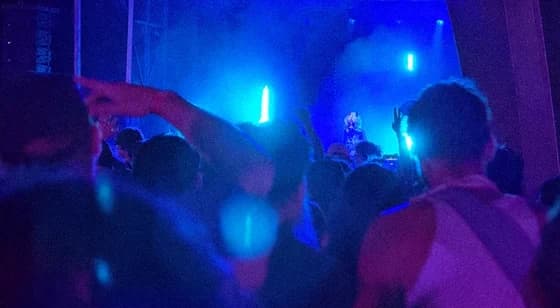
Deep blue atmosphere
For each query I selected eight positive and eight negative examples based on colour and tone. I filtered each model's ranking to those sixteen judged candidates, then counted positives in its first four slots. Across seven queries, that gives 28 evaluated slots. A separate measure counts how often a judged positive ranks ahead of a judged negative; it does not compare a complete human ranking. I also checked whether each generated graph left photographs disconnected.
The result
With CIEDE2000, still using mean LAB colour, 25 of 28 top-four slots within the judged candidate sets were positive (89.3%), compared with 24 of 28 for CIE76 (85.7%). The 3.6 percentage-point difference represents one additional positive slot in this small comparison.
Configuration | Positive slots | Components |
|---|---|---|
Mean LAB / CIE76 | 24/28 (85.7%) | 7 |
Mean LAB / CIEDE2000 | 25/28 (89.3%) | 1 |
Mean Oklab | 21/28 (75.0%) | 2 |
Oklab distribution | 23/28 (82.1%) | 1 |
Oklab palette | 20/28 (71.4%) | 2 |
The image comparison below shows actual nearest neighbours from the full saved archive ranking. It includes unjudged photographs, so these pictures are not the candidate sets used to calculate the percentages above.
Starting photograph
Mean Oklab
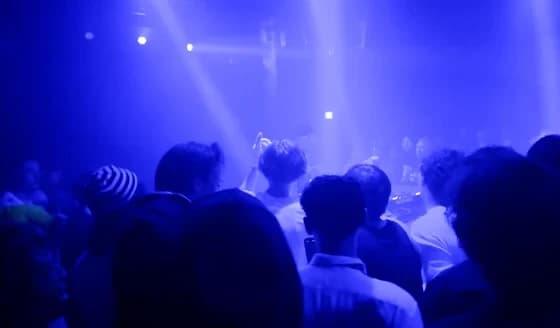
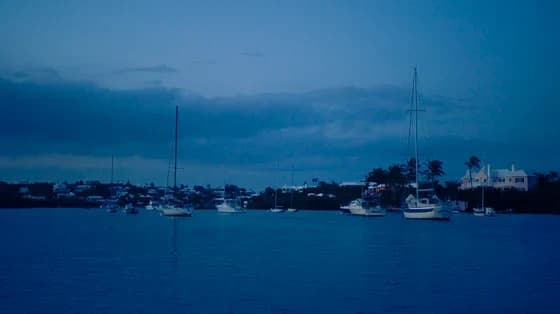

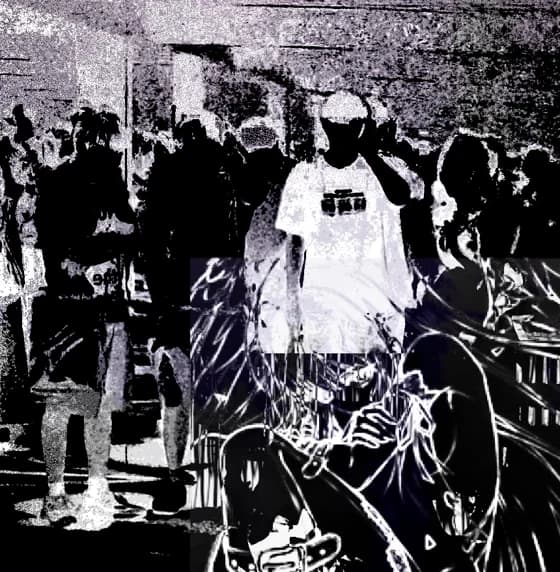
Mean LAB / CIEDE2000
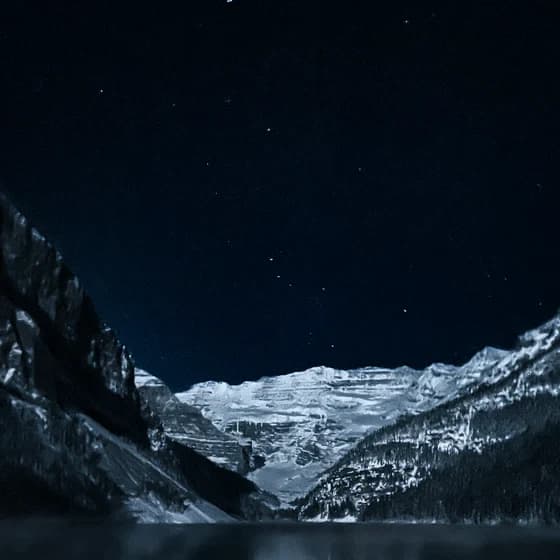

I retained mean colour because the richer representations did not outperform the selected configuration on this criterion. Its graph formed one connected component with no isolated photographs, allowing traversal through the archive. The original configuration split into 7 groups, including 5 photographs with no links. The distance thresholds also differ between configurations, so connectivity cannot be attributed to the distance formula alone. CIE76 placed judged positives ahead of negatives slightly more often: 82.15%, compared with 81.92% for CIEDE2000.
These results describe the saved August benchmark, not the current live archive.
Where it falls short
Colour matching ignores the subject. It can link unrelated scenes or separate two views of the same place because their lighting differs.
The review covers seven hand-picked starting images and my judgments of colour and tone, not a complete set of correct matches or an independent evaluation. The same queries informed model selection. Unmarked results are unjudged, not automatically wrong. The saved benchmark, judgment sets, and evaluation code make that scope inspectable. A broader relevance claim would need new assessment queries and separately collected judgments.